Every dashboard was green. That's the part that still bothers me.
Traces were clean, span durations looked normal, error rate flat and users kept reporting intermittent timeouts that no trace could explain. I spent way too long staring at Grafana convinced I was misreading something, because the alternative was that the telemetry itself was wrong.
It wasn't wrong, exactly. It was blind. The failing requests never reached the application. Connections were dying in the kernel, SYN packets retransmitting, sockets stuck in a full backlog before a single line of instrumented code ran. And code that never runs tells you nothing.
That one hurt, but it taught me where the actual boundary sits between OpenTelemetry and eBPF. Not "which one should you use", I think that's the wrong question entirely but what each layer can physically observe. So here's the map I wish I'd had that week.
The instrumentation boundary
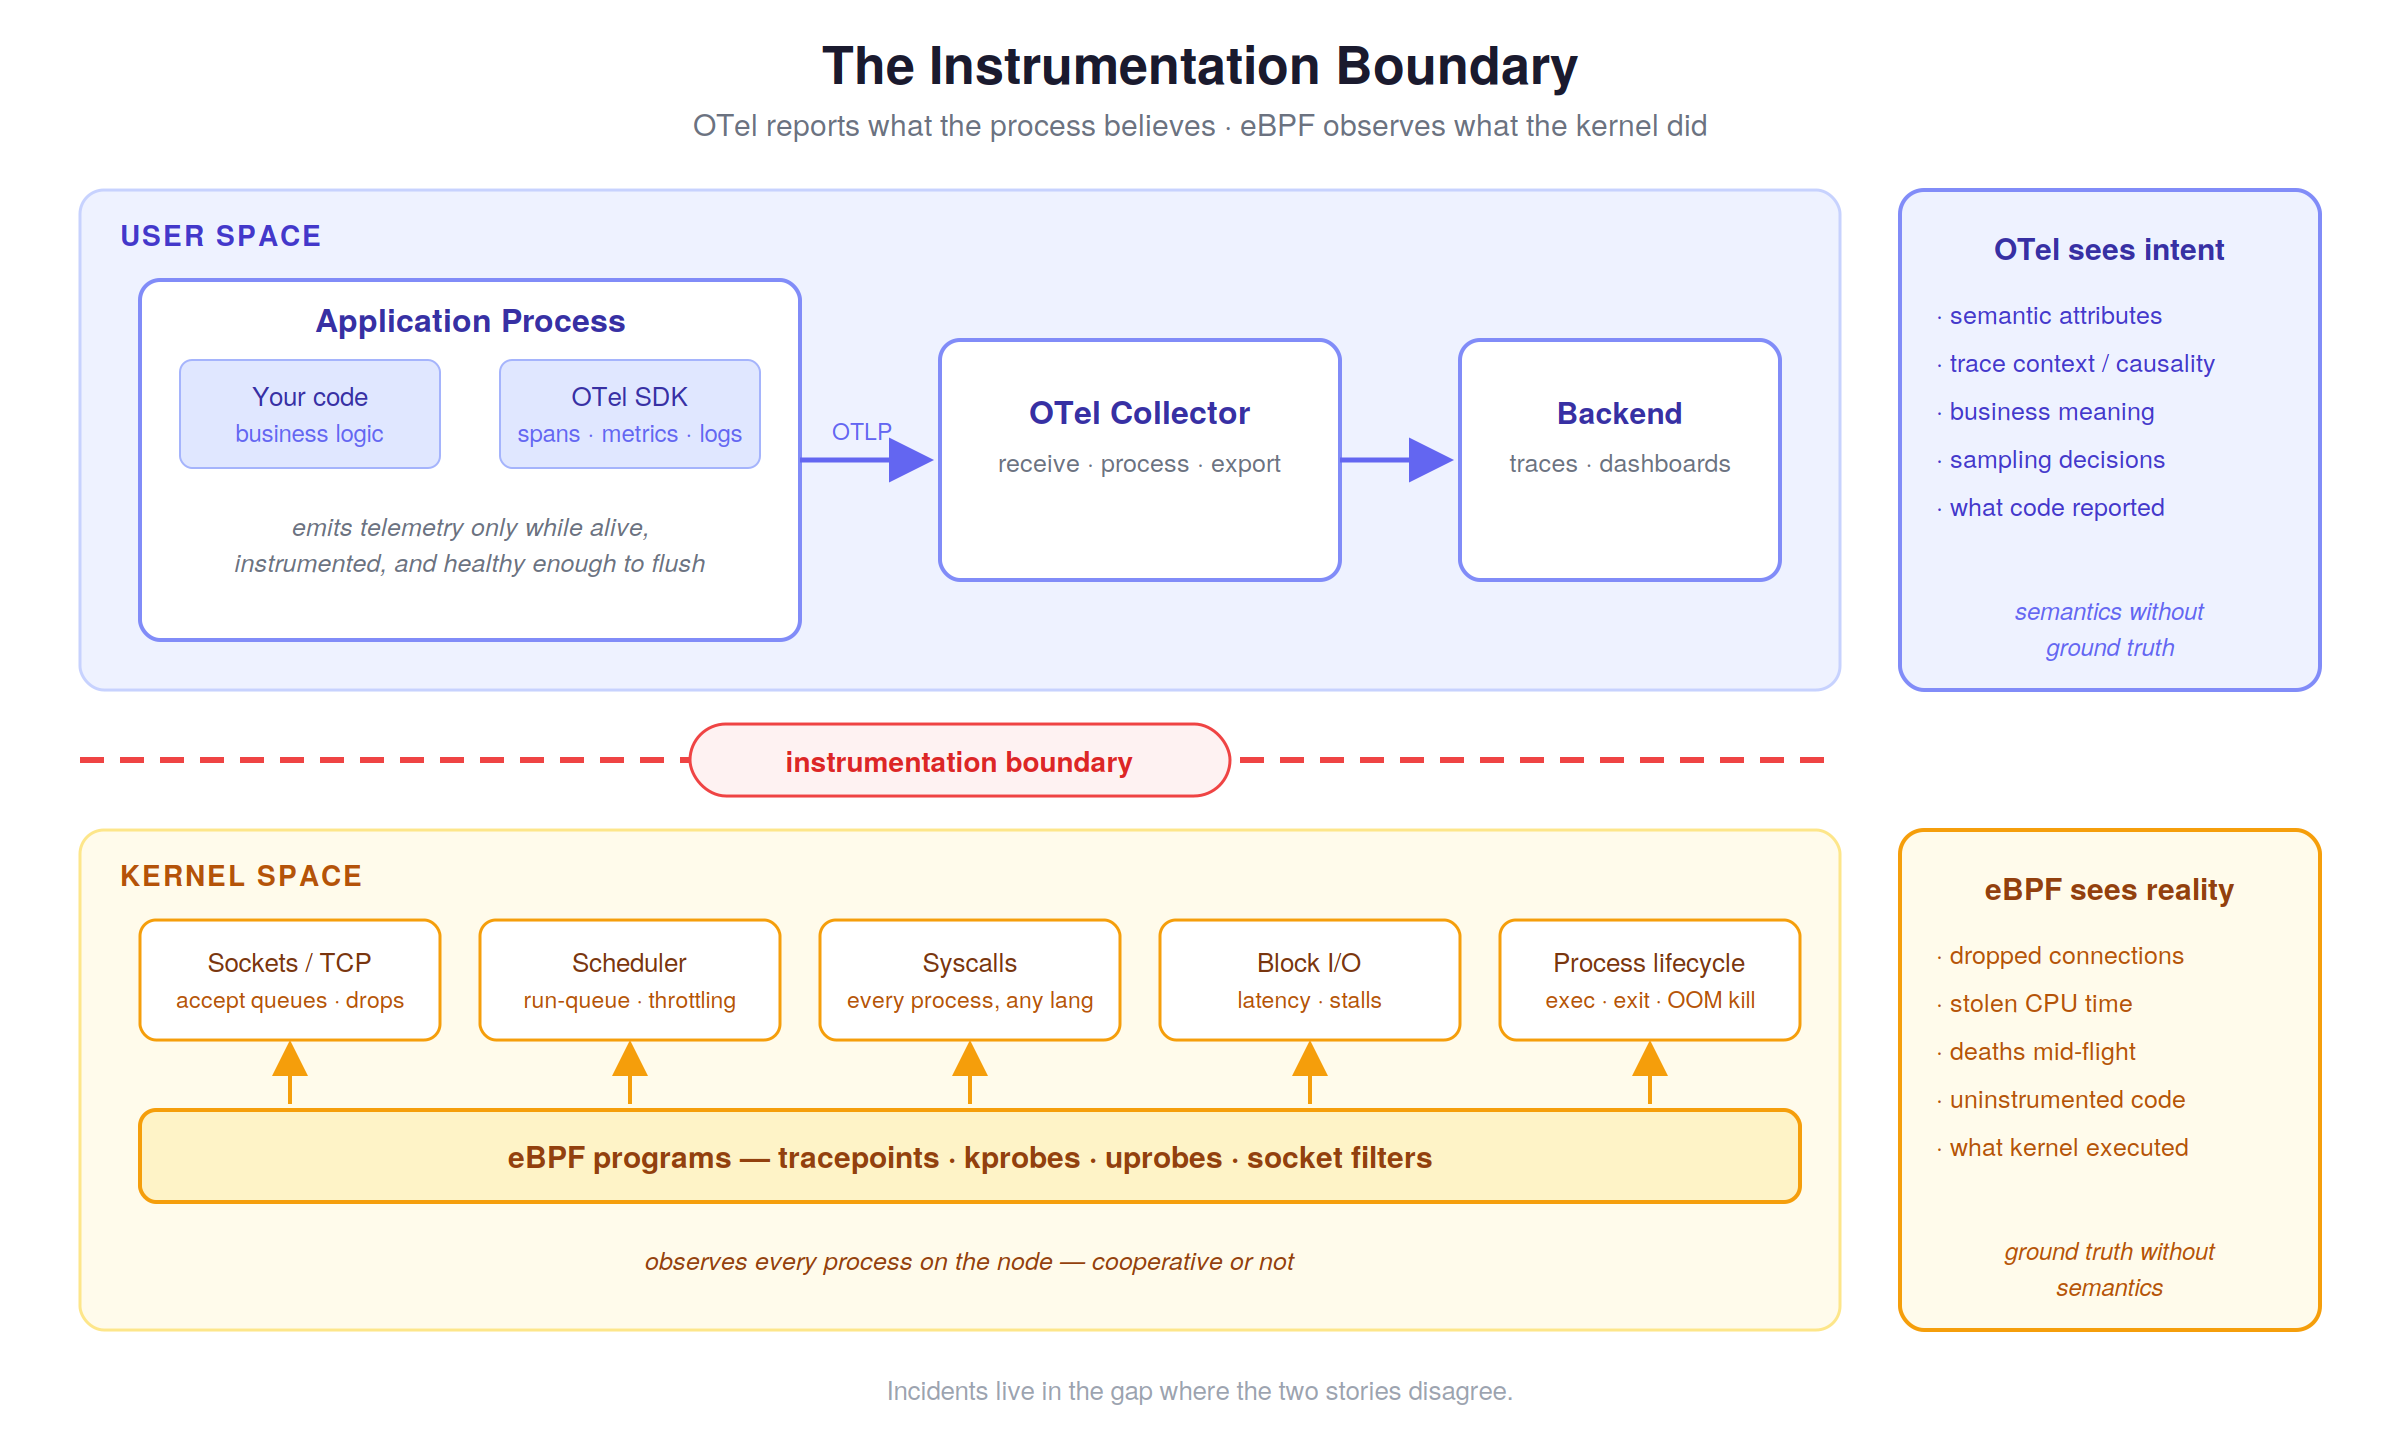
Strip away the ecosystem and OpenTelemetry is a reporting system. Your application, or an agent injected into its runtime, emits spans and metrics describing what it believes happened. Usually that belief is accurate. But it comes with a hard constraint that took me embarrassingly long to internalize: everything OTel knows comes from inside a process that is alive, instrumented, and healthy enough to flush its buffers.
It has three separate failure modes hiding in it and each one is a category of things eBPF sees and OTel structurally can't. eBPF sits on the other side. Programs attach to kernel tracepoints, kprobes, socket operations and watch what the kernel actually did, no matter which process was involved, what language it was written in, or whether it cooperated. OTel reports intent. eBPF reports reality. Most days the two agree. Incidents live in the gap where they don't.
The request that never arrived
My green-dashboard incident, so I'll start here.
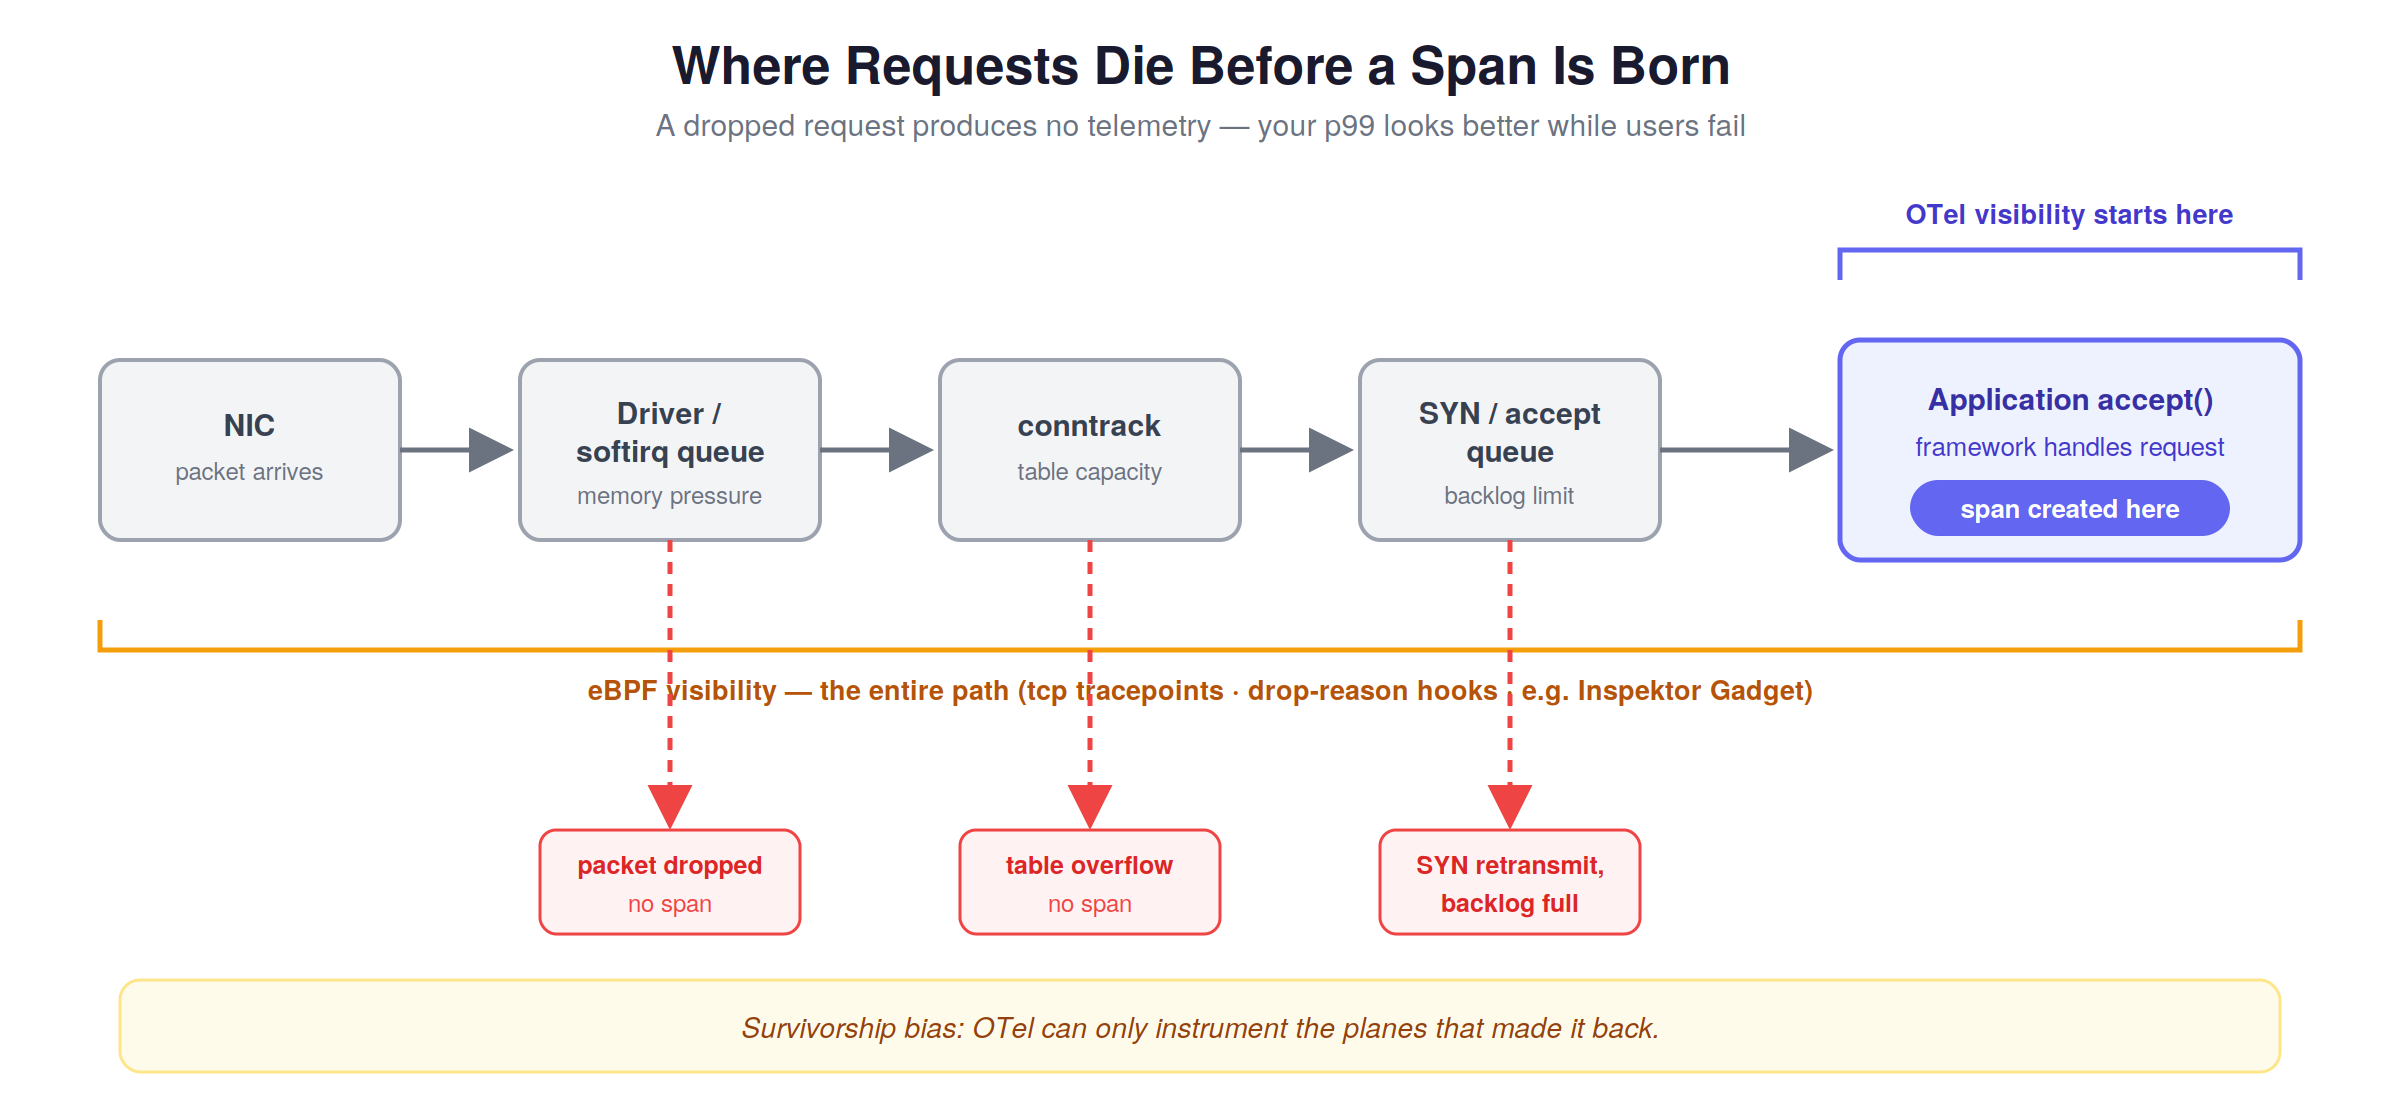
A span gets created when your server framework accepts a request. But the request has already survived a long kernel journey by then NIC, driver, conntrack, socket accept queue. If it dies anywhere along that path (full SYN backlog, packet dropped under memory pressure, conntrack table overflow), no span is ever born.
From OTel's point of view, that request did not happen. Here's the nasty part: your p99 actually looks better during this failure mode, because the slowest requests are the ones being silently dropped. Your dashboard rewards you for losing traffic. eBPF, hooked into the TCP receive path and the kernel's drop points, sees every one of them. Inspektor Gadget exposes exactly this class of kernel-level drop with pod attribution, and you don't touch a line of application code to get it.
It's survivorship bias, basically. OTel can only instrument the planes that made it back.
Time the kernel stole
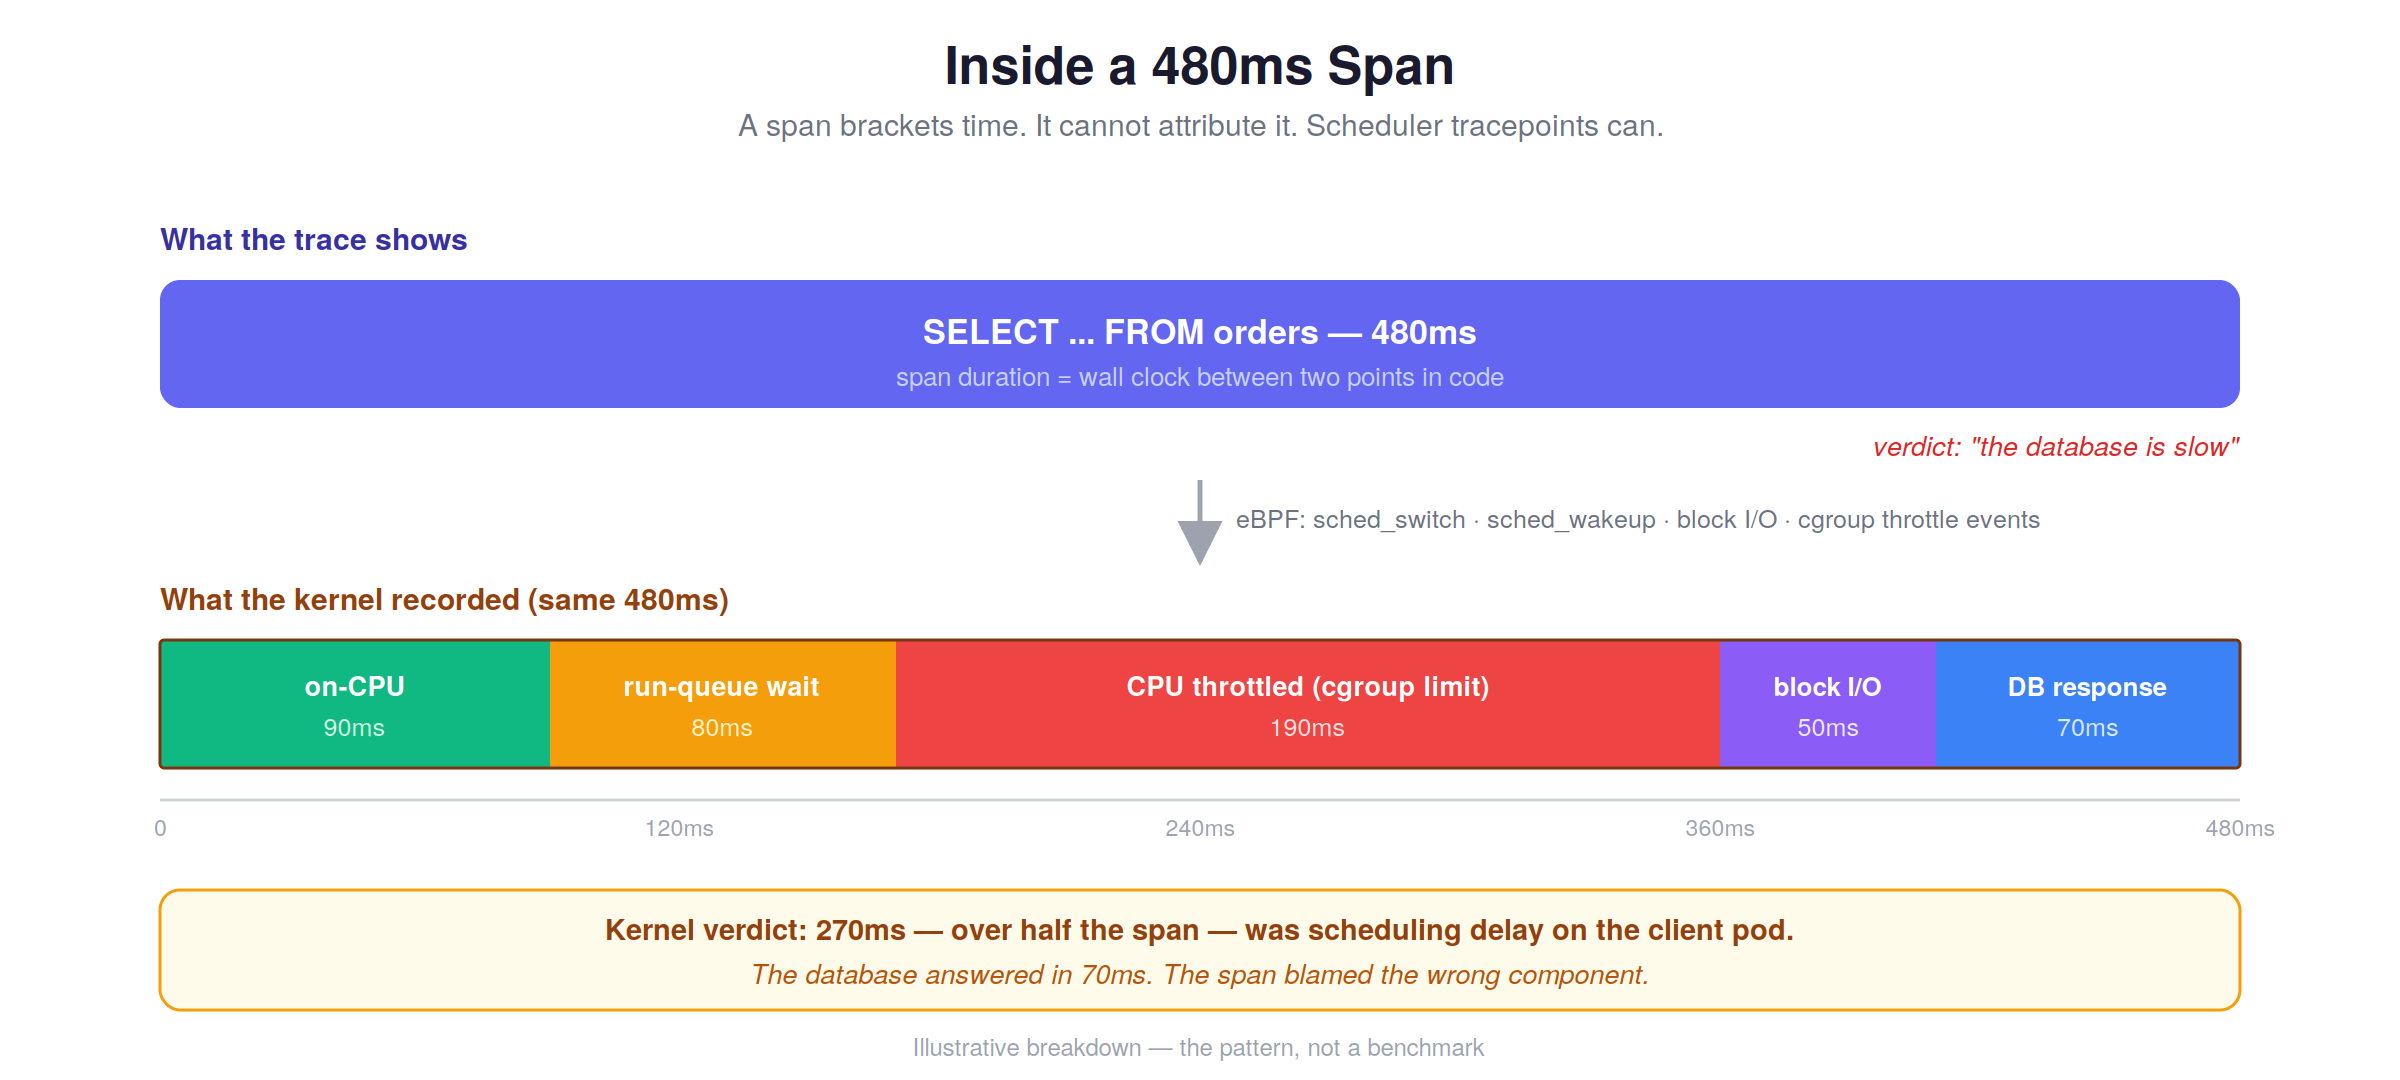
A span measures wall-clock time between two points in your code. What it can't do is tell you where that time went when your code wasn't running. CFS throttling from a CPU limit, run-queue delay on a noisy node, a disk stall, the runtime blocked on all of it gets folded into span duration as unexplained latency. I've watched a team burn two days hunting a "slow database call" that turned out to be the client pod getting CPU-throttled mid-request. The span blamed the database because a span can only bracket time, not attribute it. Nobody thought to question the bracket.
eBPF programs on scheduler tracepoints “sched_switch, sched_wakeup” can decompose that same interval into on-CPU time, run-queue wait, and block I/O. That's the layer the OpenTelemetry eBPF profiler works at. I care about this one more than most people because I spend my days around databases on Kubernetes, and this blind spot is especially cruel there. "The query is slow" is routinely a scheduling artifact of whatever else is running on the client's node. The query was fine. Everything around the query was on fire.
Processes that die with their telemetry
OTel SDKs batch. Spans sit in memory and flush on an interval, or at shutdown graceful shutdown. A process that gets OOM-killed or SIGKILLed takes its unflushed spans with it, which means the telemetry describing the seconds right before death the exact data you want during the postmortem is the telemetry most likely to be gone. I find that genuinely unreasonable since the kernel doesn't have this problem, it delivered the OOM kill and knows which process died, why, and what it was doing. An eBPF program watching the OOM path captures the death certificate the process could never write for itself.
Same story for short-lived processes, cron jobs, init containers, a CI step that lives for 400ms. By the time an SDK initializes and registers an exporter, the process is already gone. eBPF sees the whole lifetime because it never asked for the process's cooperation in the first place.
The software you can't instrument
OTel's model quietly assumes you can touch the code, or at least the runtime. A lot of a real production system fails that assumption. Vendor binaries. The legacy service nobody dares redeploy. And this is the one I keep running into the database engine itself.
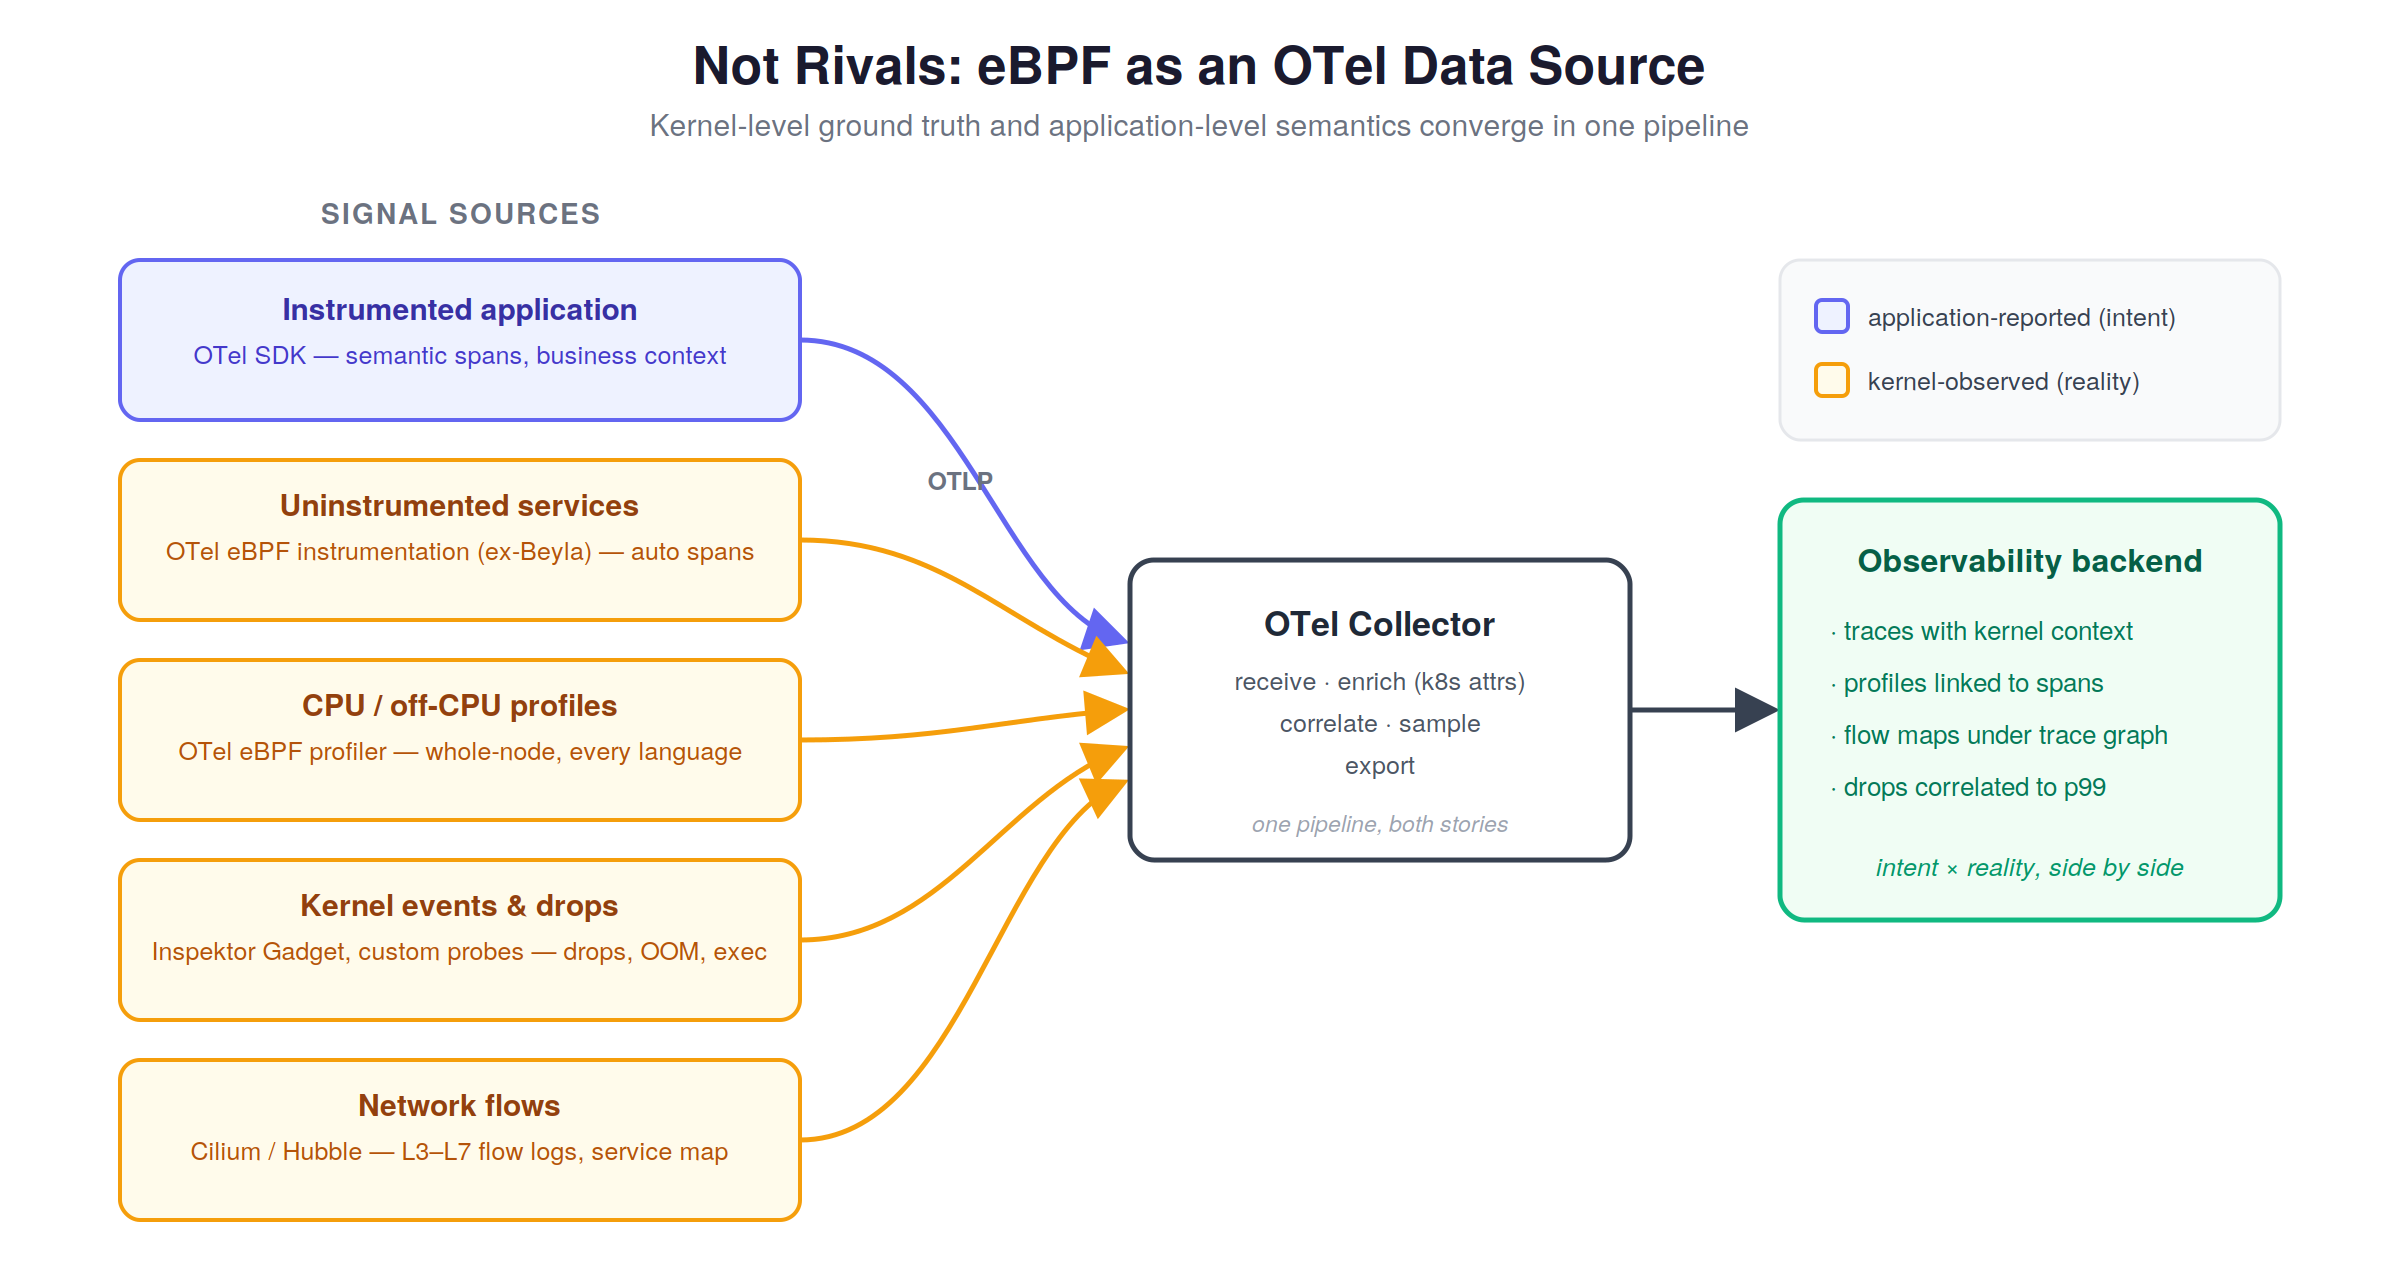
You can instrument your ORM all day but cannot practically instrument the internals of the Postgres process answering your query. But eBPF can watch the wire protocol at the socket layer, and with uprobes in the right places, see inside TLS before encryption happens. Pixie uses this to reconstruct MySQL and PostgreSQL traffic with zero app changes. And OpenTelemetry's own eBPF-based instrumentation, the work that grew out of the Beyla donation uses the same trick to produce proper OTel spans from services nobody instrumented. So eBPF isn't a competing telemetry standard, increasingly, it's becoming one of OTel's data sources.
The traffic between the traces
Even in a well-instrumented system, context propagation is opt-in. A proxy strips the headers. A queue doesn't carry them. Someone wrote a service in 2019 and it works, so nobody's touching it. The result is trace fragments of islands of visibility with dark water between them. eBPF sees every socket the kernel opens. Every peer, every byte count, whether or not a trace context rode along. It can't rebuild the causal chain; only propagation does that but it hands you the complete connectivity map underneath your partial trace graph. Cilium's Hubble builds its service map this way. When a trace dead-ends, the flow log still tells you where the request physically went next.
What eBPF can't see (and I mean can't)
I'd be cheating if I stopped there, because the inverse list is just as long. Although eBPF sees a syscall, it does not see a tenant. It sees 4KB was written to a socket, but has no idea that was a checkout for order #48291 in the EU region under a retry policy. So Business context, semantic attributes, baggage, sampling decisions informed by application state all of that only exists above the instrumentation boundary, as the kernel has no concept of what your code meant.
And distributed causality is an application-layer idea, the kernel can tell you socket "A" received bytes and socket "B" later sent some. Only propagated context can tell you the second was caused by the first. Rip out OTel and you get exquisite visibility into a system whose story you can no longer follow.
So: OTel gives you semantics without ground truth. eBPF gives you ground truth without semantics. Neither one is an observability strategy on its own, and anyone selling you otherwise is selling you half a picture.
Where I'm poking at this
The database angle is the itch I can't leave alone, so I've been experimenting with it in a side project I call KubeTracer trying to line up kernel-level socket and scheduling data against application-level query spans, so that "the query was slow" can finally be split into the query was slow versus everything around the query was slow. It's early and it's messy, and half of what I've learned so far is how annoying timestamp correlation across the boundary actually is.
But you don't need to build anything to act on this, just run OTel for your application semantics and then add one eBPF-powered lens wherever your traces keep dead-ending - Inspektor Gadget for kernel drops, the OTel eBPF instrumentation for services you can't touch, Hubble if you're already on Cilium. Pick a bad five minutes and compare what the kernel saw against what your spans claimed. In my experience the two stories diverge more often than anyone expects, and that gap is an incident you were previously going to debug blind.
The dashboards being green was never the goal, the goal is making sure metrics in dashboards are true.